

Identifying Successful Direct Mail Campaign Analytics: 5 Questions to Ask
Today’s marketers have access to a variety of direct marketing campaign performance insights throughout the customer journey, which is propelling them to build better informed multichannel marketing strategies – and they are consuming this data in droves. Salesforce research found senior marketers anticipate referencing an average of 15 data sources when making campaign strategy decisions this year. And although marketers are appreciative of the influx of performance metrics, 83% admit to becoming data blind as they comb through campaign analytics to determine which marketing mediums to invest in and which to abandon.
The unfortunate reality is a performing channel may be disregarded due to an incomplete dashboard or by mistakenly focusing on the wrong success metrics for the channel. If you’re running a solo direct mail program or including direct mail as part of a larger multichannel strategy, this article will help you identify successful direct mail campaign analytics to maximize your advertising budget and enhance program performance.
How to identify successful direct mail campaign analytics
There is much more to a successful direct mail campaign than a beautiful piece of creative and hitting your in-home target date. Before campaign execution begins, ask yourself these five questions to identify which direct mail campaign analytics will signal a win for your brand.
Question #1: What are the main KPIs for your brand?
Each brand is different, and so are its KPIs. If you’re one of the 38% of marketers who struggle to understand what data is most important to decision makers, have a conversation with your leadership team and your direct mail agency to determine your brand and channel goals. Then prioritize and develop your campaign from there.
Common direct mail KPIs include sales rate, leads, response rates, cost per acquisition (CPA), customer acquisition cost (CAC), cost per lead (CPL), revenue, return on investment (ROI), return on ad spend (ROAS), and lifetime customer value (LTV). Forcing your mailing (or a client’s mailing) into a one size fits all KPI is a costly mistake that will eventually kill a mail program.
Here are some examples of how different brands may prioritize direct mail KPIs, and how these metrics affect your bottom line:
- A Medicare broker who sells live calls to other companies is going to be most concerned about leads and CPL.
- A meal kit delivery brand may care most about revenue or lifetime value as recurring purchases are the highest priority.
- A public company trying to impress Wallstreet may prioritize the number of sales more than any other profitability metric.
- A fitness equipment brand might care most about CAC or CPA because they need to make sure they are acquiring customers for less money than they make on a one-time sale.
Question 2: How are you reading performance?
When determining how you will read campaign performance, it’s important to consider all the ways a recipient can respond to your mailing. Tracking direct mail campaign activity with a directly attributable element, such as offer code redemptions, landing page activity, telephone calls, QR codes, etc., is a simplified way to track a percentage of your responses. Including digital response options can boost direct mail response, but these elements only capture an average of 25% of direct mail responses. It’s more common for your brand to experience an increase in direct traffic, paid and organic branded search, and a general lift in all channels as your audience bounces between mediums with increased brand exposure.
Direct mail is an attributable offline media channel because marketers have the ability to identify the individuals that were served an impression, i.e. your mailing list. Therefore, a better way to measure performance is to watch for a lift in all channels during your determined read period (60-90 days depending on the product or service), and then tie this action back to the mail channel. By matching all sales generated over your mail campaign’s read period back to your sale file, you can identify with certainty that your mailer did have an impact on the sale.
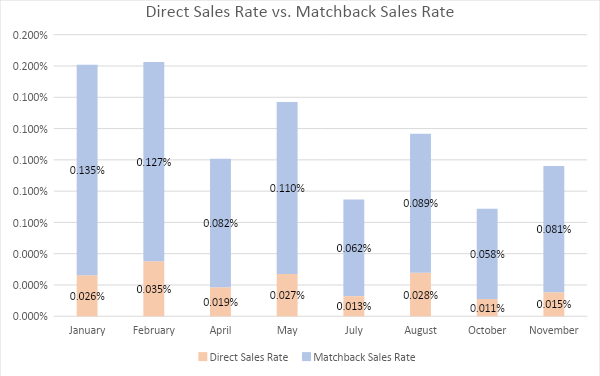
The chart above shows the relationship between direct sales (directly attributable) and matchback sales on direct mail campaign performance.
With a complete picture of the sales driven by mail, you will increase the probability of finding successful direct mail campaign analytics.
Read this Direct Mail Attribution Guide to learn more about tracking direct mail performance and building direct mail attribution strategy.
Question 3: What are your expectations for your direct mail program?
While search, social and other digital channels may produce a CPA of $50, that is not always a realistic expectation for direct mail – especially in young programs.
As an offline channel, direct mail testing has incremental costs. You need to consider creative development, audience model development, low economies of scale on production and postage, as well as the impact of unproven data and creative. Unlike digital channels, you cannot pivot direct mail strategy or package creative on a dime. Once a piece has been mailed you need to practice patience as you gather analytics and learnings – the good, the bad, and the ugly. While the initial test may not exceed your KPI threshold, hopefully your best combinations of creative, list and offer are close. Your subsequent tests will continue to present learnings that will move you closer to optimizing your direct mail program strategy.
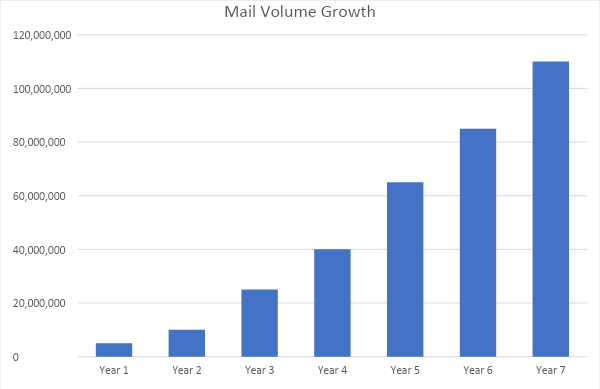
Successful direct mail analytics should concentrate on scale. Direct mail can routinely generate tens of thousands of sales per month for a mature mailer. Scale like this cannot be provided by digital channels, such as search marketing.
In the chart below, you’ll see the mail volume growth of a direct-to-consumer brand over seven years. During this time, the brand consistently increased mail volumes and found significant business scale. Direct mail is now one of the brand’s top two conversion channels, responsible for driving over 2MM new customers and $500MM in revenue.
Do not fall into the trap of comparing efficiency from digital to direct mail because you’re not comparing apples to apples. Within your marketing mix, consider the strength of each individual channel, each channel’s objective, and how each of those objectives fit into your overall strategy. If you’re looking to scale customer acquisition, your focus should be on understanding your CPA tolerance rather than dwelling on how direct mail CPA compares to other channels.
Check out this infographic for a visual illustration of the relationship between LTV and CPA, and what these metrics mean for your bottom line.
Question 4: Are you reporting analytics, or are you analyzing analytics?
Reporting analytics is broadcasting what worked and what did not. Analyzing analytics is understanding why something worked or did not work, and then implementing a strategy for improvement.
Direct mail performance dashboards should not just report the data, but rather show actionable and understandable metrics. The following demonstrates how you can obtain useful insights when studying your direct mail campaign analytics:
- If a new creative asset beat your control on all KPIs, what was it about that test creative that did so well? What were the variables that were different that may have led to that result? Based on this, is it best to validate the results, roll out a new control, and/or test a derivative.
- If a list source underperformed compared to your control list mix, what was the make up of that list? Is there a key segment that underperformed? Are there segments that showed promise? Was the seed audience wrong for the database? What are the next steps?
- Offers should always be reviewed on multiple revenue KPIs as sales rate alone never tells the full story. For example, if two offers tied in sales rate performance, look closely at one month revenue. What does LTV project based on the early results?
Question 5: Are your results valid?
Just like scientists need to conduct scientific research, it’s a best practice for marketers to run statistical validity calculations during direct mail tests to determine the legitimacy of your mail campaign performance. Invalid results will jeopardize the success of your direct mail analytics and can result in large-scale program failure.
When conducting a direct mail test, statistic validity is a function of volume, response, and relative lift. This calculation ensures the sample size is large enough to predict a meaningful relationship between the variables being tested – as even the most scientific set up for quantities per cell can produce baseless results if the lift is not large enough.
For example, you may experience a double-digit percentage lift in sales rate from one list source to the next, but if you do not have enough responses per cell, the result may not be valid. Therefore, you should not take future campaign actions based on the result. Rather, test again at a larger volume so you can be confident in the results, protect your investment, and produce performing campaigns at scale.
This e-book shares nine of the most overlooked, yet avoidable, direct mail testing mistakes to maximize your ROI.
In Summary
Answering these five questions will help you obtain an accurate and aggregate view of your direct mail performance. With successful direct mail campaign analytics, you will feel confident about the impact direct mail is having on your bottom line, allowing you to make educated decisions about future campaign strategy.
Originally Published by Who’s Mailing What!, Written by Patrick Carroll, Director of Strategy at SeQuel Response
Continue to learn about direct mail campaigns through our blog! Read “Direct Mail Trends and Predictions for 2022”!